Hit Rate vs Forward Returns
- ajitagrawal62
- Jun 19, 2024
- 3 min read
Updated: Jun 24, 2024
Ajit Agrawal, Suchita Sridhara*, Neeraj Sudhakar
For our revenue Nowcast, clients often ask which companies (of the 120 we track) do we have more “confidence” in. “Confidence” can be expressed through many metrics (e.g., historical errors, hit rates, forward returns). Our favorite metric for this purpose is the hit rate - the percentage of time that AKAnomics historical weekly revenue estimates for a company were on the right side of consensus (i.e., both the AKAnomics estimate and the actual value came in on the same side of consensus). It is a simple metric. Without access to differentiated information, one shouldn’t expect a better than 50% hit rate. Our experience shows that Sell-Side Research does no better than 50% either. AKAnomics hit rates, however, average 66% (typical range of 60-80%), charged by a systematic analysis of thousands of macro-economic data points to inform us of potential gyrations in different industries of the economy, and as a result in company revenues.
Higher hit rate, by definition, suggests more ability to identify revenue disconnects from consensus. What convinces us further on this metric of confidence, is that higher hit rates historically translate into higher forward weekly returns.
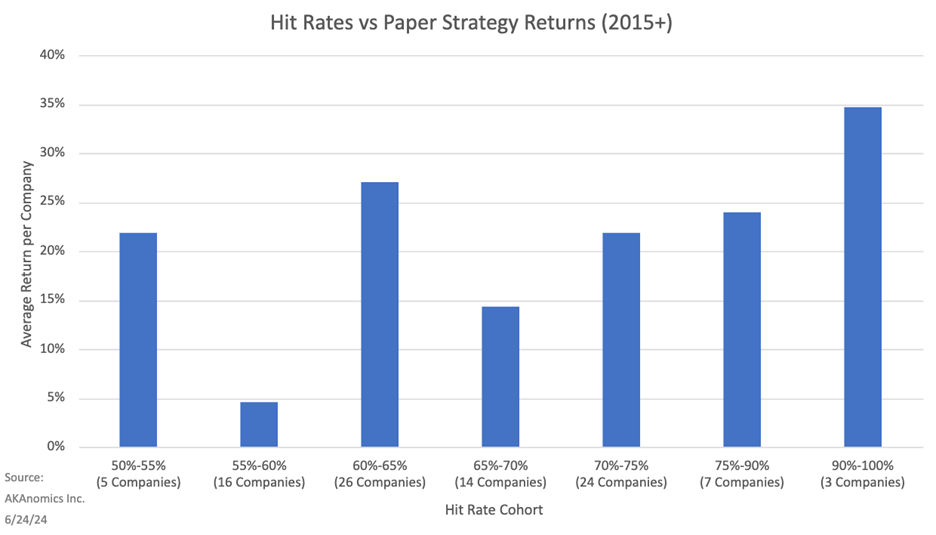
For our experiment, we identified each event where AKAnomics estimate pointed to a revenue beat/miss for a company at any week. Beat/miss events imply significant deviation of our estimate from consensus (0.75 or more historical standard error). For each such event, we looked at forward 1-week return of that company relative to XLI (Industrials) Index – (positive for revenue beats, and negative of the returns for revenue misses), and added up the returns since 2015. The graph below illustrates the relationship between such company-level total sector neutral returns since 2015 and its weekly hit rate. We point out two aspects of this graph: i) There is a linear relationship between hit rate and returns - a company with 60% hit rate on average has 10% lower return than those with 80% hit rate (every 10% increase in the weekly hit rate corresponds to approximately a 5% increase in returns for this period); and ii) Even though there is considerable noise in this scatterplot (which is not unexpected for a very noisy returns series), the relationship pattern is quite identifiable.

The relationship can also be seen when combining all the companies into cohorts by hit rate (see chart below). There are some aberrations in the data, especially for the lower hit rate companies (50-55%), where we should expect little to no return on average.

We further asked ourselves if there is a way to cross-check our results through another approach. One way to think of a 100% hit rate as a perfect estimate with no errors. Since we know that a perfect estimate corresponds to the company’s actual revenues, we ran a hypothetical experiment assuming advanced knowledge of the company’s actual revenues. We found the average forward sector-neutral 1-week return for a perfect signal to be 0.254% per event vs our signals generating 0.10% per event (a 2.5 multiple). If we were to assume all events having similar results, a 2/3rd hit rate implies 2/3rd correct and 1/3rd incorrect outcomes, implying 1/3rd impact relative to perfect signal (a 3x multiple) – giving further credence to our analysis of hit rates vs returns.
* Suchita Sridhara is a Summer Intern at AKAnomics Inc, and we thank her for her contributions. Suchita is an undergrad at Wesleyan University.
.png)


Comments